Each year as I continue to join the after Thanksgiving shopping madness, I walk through the stores, looking at these "drastic" price cuts, wondering what the actual savings are on these products. Luckily, I live in the age of digital everything! I whip out my phone, look on Amazon and other sites and compare the in-store sales prices with the prices online. I then figure out the percentage difference and monetary savings between the original and sales prices. I ask myself: How good of a deal am I really getting? How satisfying is the sales price? Is it worth buying it now? I then use that data to gauge what goes into my cart.
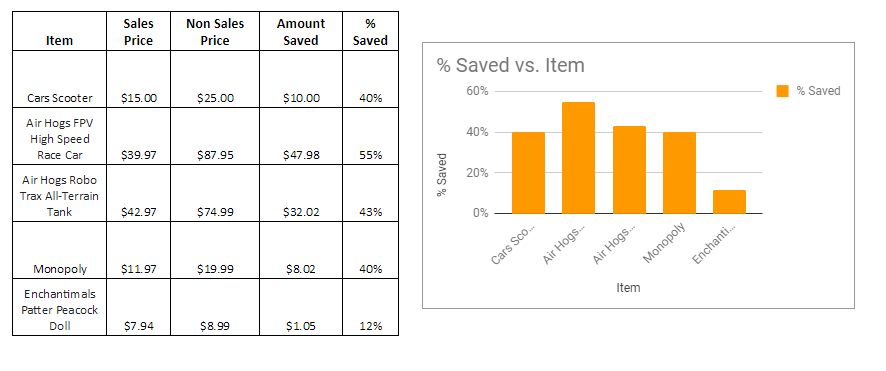
Wait... I am using math in the real world! Your students can too. Students can use Black Friday (or any sales ads) to find the amount or percentage savings on their choice holiday gift. They can choose 5 items, research the non-sale price for each item, create a table showing both prices, the amount saved, and the percentage saved (if applicable) and then graph the differences. See an example below:
If you would like to know more or need ads to utilize, please let me know!
No comments:
Post a Comment